Introduction to Micro and Nano Sensing Principles
About Sensors
Defining the Sensor and Transducer
In the realm of Micro-Nano systems, we must first establish a rigorous vocabulary. According to the American National Standards Institute (ANSI), a sensor is a device that provides a usable output in response to a specified measurand (the physical quantity, property, or condition being measured).
While a sensor acquires a physical parameter and converts it into a signal suitable for processing (optical, electrical, or mechanical), a transducer is a broader functional classification. A transducer converts energy from one domain to another. Familiar examples include:
- Microphones: Transducing sound pressure into electrical signals.
- Loudspeakers: Transducing electrical signals into sound pressure.
- Biological Senses: Our senses of touch or sight transduce environmental stimuli into neural impulses.
Sensor technology is the essential bridge between the stochastic physical world and our deterministic digital systems. Without these interfaces, the "Libelium Smart World" or the Internet of Things (IoT)—ranging from smart roads and radiation monitoring to wine quality enhancement—would have no data to process. Sensors provide the "nervous system" for modern automation.
Criteria for Sensor Selection
Selecting a sensor is never a "plug-and-play" decision; it is an exercise in managing engineering trade-offs. We categorize these constraints into three primary domains:
- Environmental Factors:
- Temperature range
- Humidity effects
- Corrosion
- Size
- Overrange protection
- Susceptibility to EM interferences
- Ruggedness
- Power consumption
- Self-test capability
- Economic Factors
- Cost
- Availability
- Lifetime
- Sensor Characteristics
- Sensitivity
- Range
- Stability
- Repeatability
- Linearity
- Error
- Response time
- Frequency response
Examples of Sensing Principles
Quantifying Sensor Performance: What Makes a "Good" Sensor?
Confuse resolution, sensitivity, and responsivity? Let us clarify:
- Resolution (分辨率): The smallest detectable change in the measurand. It is the absolute floor of what the sensor can "see."
- Responsivity (响应度): This is the input-output gain. For linear systems, it is a constant ratio; for nonlinear systems, it is the local slope (the derivative) of the response curve.
Example: Photodetector (optical signal is converted into an electric current)
Responsivity = electrical output per optical input.
- Sensitivity (灵敏度): the minimum magnitude of input signal required to produce a specified output signal having a specified signal-to-noise ratio, or other specified criteria.
Responsivity and Sensitivity have very different definitions in Engineering and Science disciplines!
- Signal-to-Noise Ratio (SNR): The ratio of signal power to noise power. Even a high-responsivity sensor is useless if the SNR is below 1:1, as the information is lost in the noise.
- Accuracy vs. Precision:
- Accuracy (准确度) is closeness to the true value (hitting the bullseye).
- Precision (Repeatability 精密度) is hitting the same spot consistently, even if it is not the bullseye.
- Hysteresis: The difference in output when an input is approached from an increasing vs. decreasing direction.
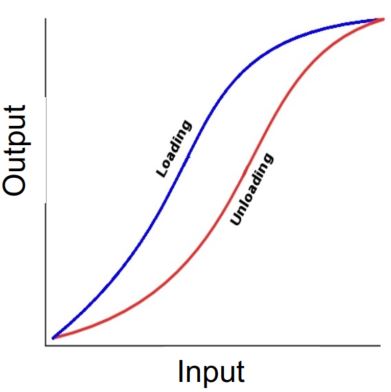
In this graph, Force (Y-axis) is plotted against Extension (X-axis). You will notice two distinct paths for Loading and Unloading. This lag indicates that the material "remembers" its previous state, a critical factor for engineers to compensate for during calibration.
Micro Force Sensing Principle
Piezoresistive Sensors
Piezoresistivity (压阻效应) is the change in electrical resistivity (
Crucial Note: Unlike the piezoelectric effect (压电效应), this does not produce a voltage; it only changes the resistance.
The Physics of Scale:
In Metals, the change in resistance is primarily due to geometry changes (
Mechanical Context & Placement:
Mechanical stress (
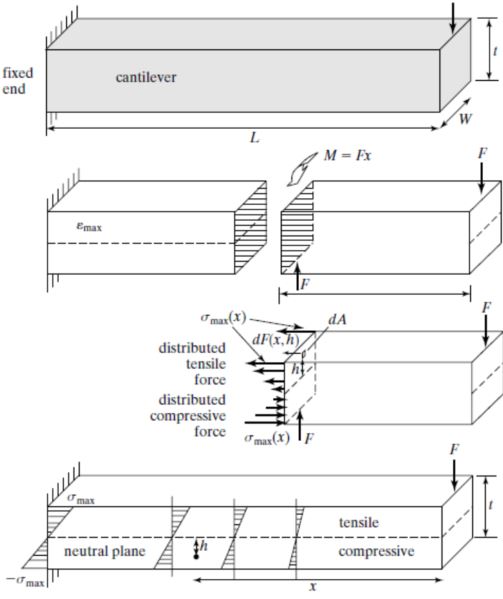
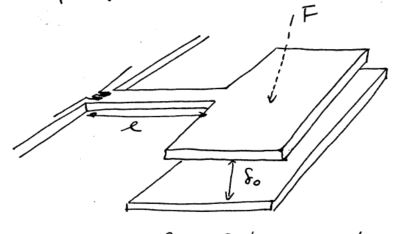
In a cantilever, stress is distributed around a neutral plane. One side of the plane undergoes tensile stress (positive strain), while the other undergoes compressive stress (negative strain).
Pedagogical Note on Placement: If we are designing a diaphragm-based pressure sensor, where do we place our silicon
To calculate the stress and strain:
If a constant force
where
Gage factors: the relation between deformation and resistance
and
- Metals: changes in geometry dominate
- Semiconductors: changes in resistivity dominate (strain causes differences in atomic spacing, which in turn causes changes in band gaps and thus
)
Piezoresistors are resistors made from a piezoresistive material and are usually used for measurement of mechanical stress.
location of piezoresistors
bridge balancing
Piezoelectric Sensors
Derived from the Greek piezo ("to squeeze"), Piezoelectricity is the charge which accumulates in certain solid materials (crystals, ceramics, bone) under strain.
When a neutral molecule is stressed, its internal charge distribution is disrupted, causing charge to accumulate on the surface. Unlike the resistive type, these generate a voltage (
Above equations are valid when force is applied in the length
(Note: Here,
Piezoelectric Effect
where:
: dielectric displacement : mechanical strain vector : applied electric field vector : mechanical stress vector : piezoelectric coefficients : dielectric permittivity : elastic compliance matrix
Frequency dependent output of Piezoelectric Sensors
- A piezoelectric sensor has very high DC output impedance and can be modeled as a proportional voltage source and filter network. The voltage V at the source is directly proportional to the applied force, pressure, or strain. The output signal is then related to this mechanical force as if it had passed through the equivalent circuit.
Transverse Effect
Beyond simple longitudinal sensing, we often utilize the Transverse Effect. This allows us to decouple the charge-generating axis from the neutral axis. This is vital for designers because it provides a mechanism to fine-tune sensitivity by adjusting the b/a ratio (the ratio of the dimension in line with the charge generating axis to the dimension in line with the neutral axis).
where
Longitudinal Effect
The amount of charge produced is strictly proportional to the applied force and is independent of size and shape of the piezoelectric element. Using several elements that are mechanically in series and electrically in parallel is the only way to increase the charge output. The resulting charge is:
where:
is the piezoelectric coefficient for a charge in xdirection released by forces applied along -direction (in pC/N) is the applied Force in -direction (in N) corresponds to the number of stacked elements
Shear Effect
The charges produced are strictly proportional to the applied forces and are independent of the element’s size and shape. For
In contrast to the longitudinal and shear effects, the transverse effect opens the possibility to fine-tune sensitivity on the force applied and the element dimension.
Comparative Analysis: Sensing Principles
When choosing a principle, we look at the Threshold (minimum detectable input) and the Span to threshold ratio.
"Responsivity": capacitive or piezoresistive?
Should we use capacitive or piezoresistive principle to measure displacement of diaphragm for a pressure sensor?
Comparing piezoresistive and capacitive sensors
- Assume:
: effective moment arm (the moment on the fixed end by ) - Given (From the previous chapters):
- Piezoresistive sensor:
- Capacitive sensor:
Now, for piezoresistive sensors:
find
For capacitive sensors:
Then,
- Assume the "-" sign can be eliminated by circuit design.
- Assume
is small comparing to , so . (This's convenient for 1st order approximations)
Hence,
Note:
So,
For
As we have learned,
Note:
- This is contrast to our understanding that the greater the "sensitivity", the better a sensor is. From the above definition, a sensor with lower sensitivity is better because it'll have lower system output noise or higher responsivity
- Think of "sensitivity" as the smallest quantity of signal that you can detect with your sensor that you're sure is not a noise signal
Conclusion
- Piezoelectric: Offers the highest Span-to-threshold ratio (100,000,000), making it ideal for high-dynamic-range applications, though it has a relatively high threshold (5.0).
- Piezoresistive: Boasts an incredibly low threshold (0.0001) and a high span ratio (2,500,000), perfect for high-precision micro-sensing.
- Inductive & Capacitive: These provide moderate thresholds (0.001 - 0.005) and lower span ratios, often used where non-contact sensing is required.
Signal Conditioning and The Wheatstone Bridge
In MEMS,
The bridge output
Engineering Intuition: Why the subtractions? This math enables Common Mode Cancellation. If the temperature changes, all resistors change equally; because the bridge subtracts the changes in adjacent arms, the temperature noise cancels out. Furthermore, because the center and boundary of a diaphragm have opposite signs of strain, we place them in adjacent arms so the negative signs cancel out, making the final signal additive and significantly enhancing sensitivity.
Comprehensive Glossary of Technical Jargon and Formulas
- Measurand: The physical quantity being measured.
- Transducer: A device converting energy between domains.
- Piezoresistivity Formula:
(where is the piezoresistive coefficient). - Gage Factor (
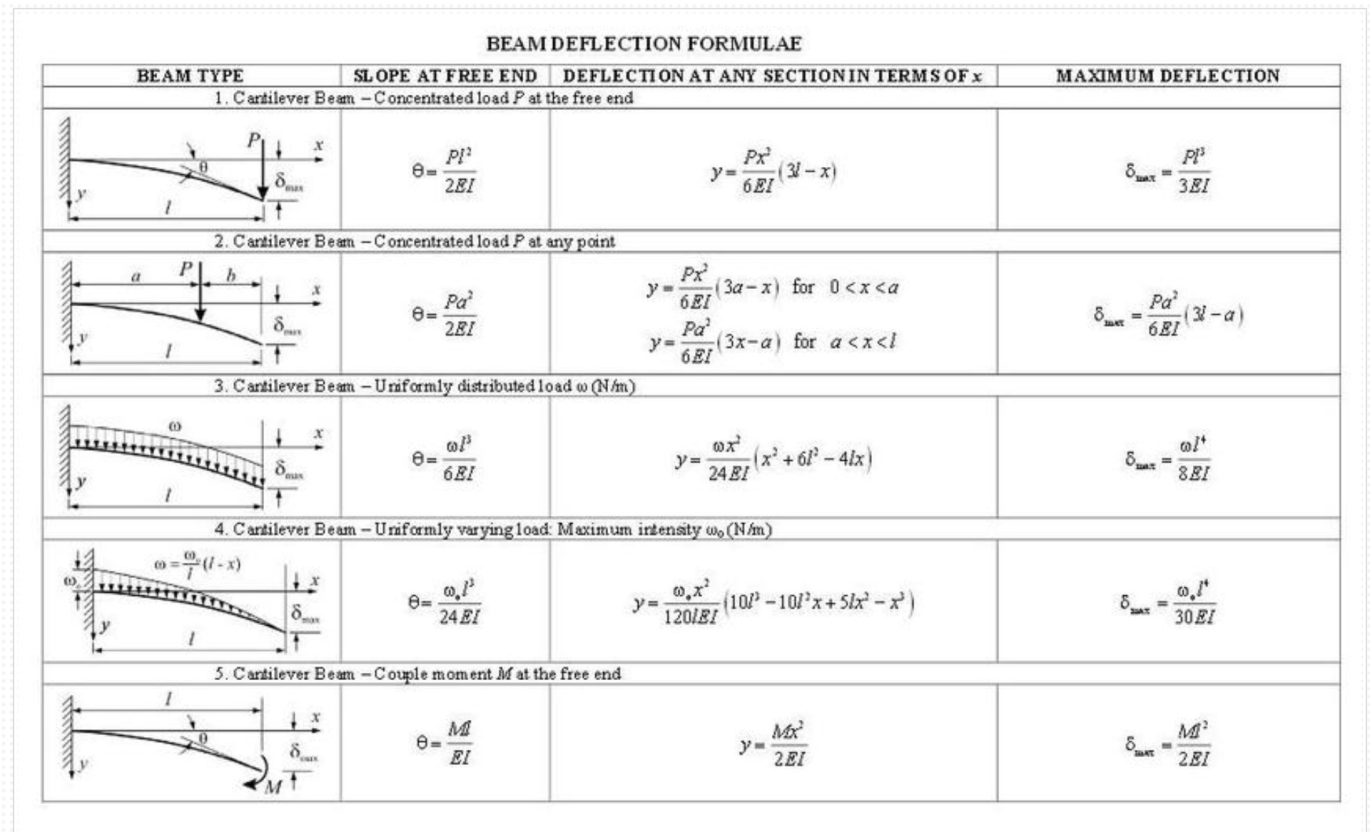
): . A measure of the sensitivity of a strain gage. - Cantilever Deflection (
): . - Flexural Rigidity (
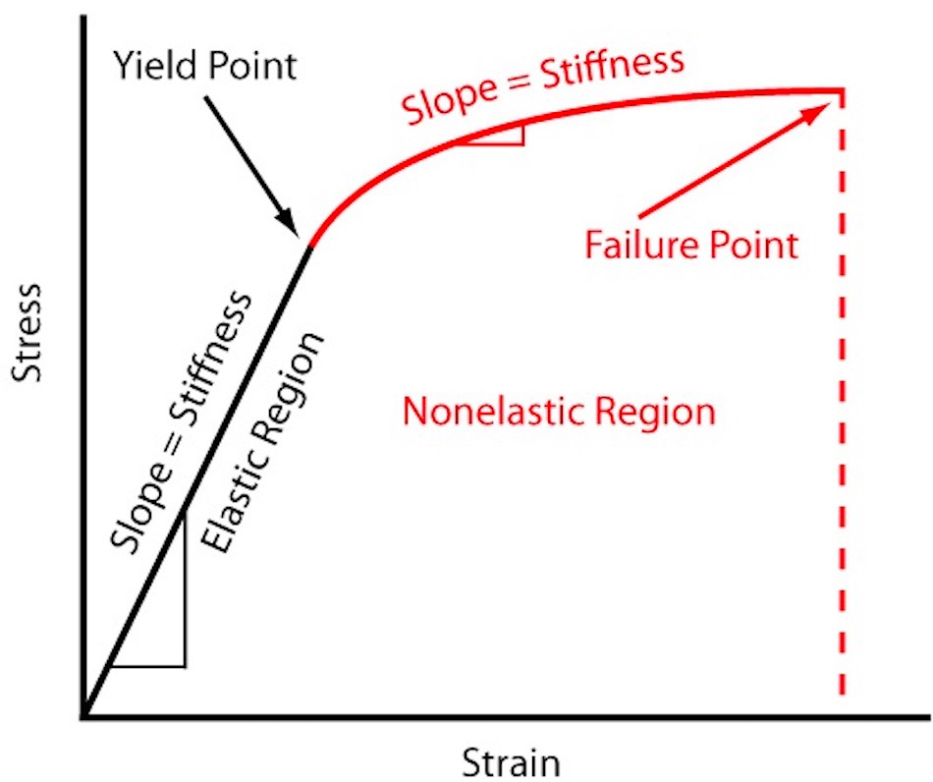
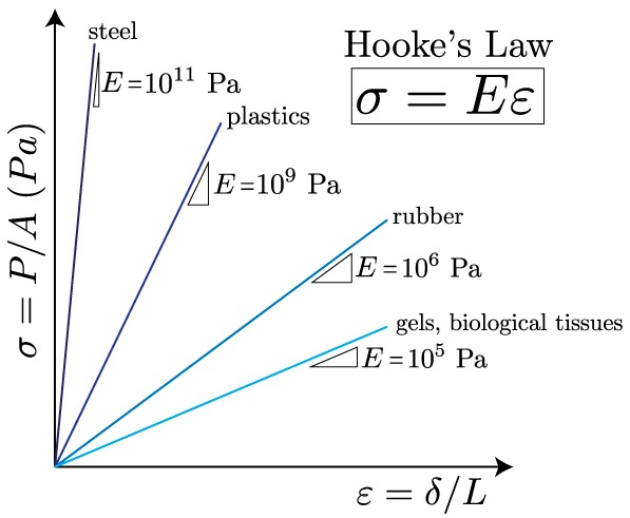
): The stiffness of a beam; the product of Young's Modulus and the area moment of inertia. - Young's Modulus (
): The ratio of stress to strain in the elastic region. - Piezoelectric Coefficient (
): The ratio of electric charge generated per unit of applied force. - Permittivity (
): The measure of a material's ability to store an electric field. - Span: The range between the minimum and maximum limits of a sensor's measurement capability.
- SNR: Signal-to-Noise Ratio (Power Signal / Power Noise).
- Hysteresis: Output lag behind the input during loading/unloading.
Conclusion: Characteristics of an Ideal Sensor
As you progress in your design careers, aim for these "Ideal" metrics:
- High responsivity, i.e., give a large output voltage when the input is a small quantity
- Stability & Low Drift: Reliable over time and temperature.
- Repeatable output
- Linearity
- Low Hysteresis
- Fast frequency response, wide Bandwidth: Fast, consistent response to dynamic inputs.
- Low power consumption
- Small volume and weight
Question
What are the basic concepts used to describe quantitatively what is a good sensor?
To describe quantitatively what constitutes a "good" sensor, several key performance concepts and parameters are used to measure its effectiveness, reliability, and precision:
Core Measurement Concepts
- Resolution: This is defined as the smallest change the sensor can detect in the quantity it is measuring. It is distinct from responsivity and sensitivity, though the terms are often confused.
- Responsivity: This measures the input-output relationship (the gain or ratio) of a detector system. For linear systems, this is a unique value; for nonlinear systems, it is the local slope or derivative of the response curve. In MEMS design, responsivity is calculated as the Change in Output / Change in Input.
- Sensitivity: In the context of detection devices, sensitivity is the minimum magnitude of input signal required to produce a specified output signal that meets a specific Signal-to-Noise Ratio (SNR) or other criteria.
- Signal-to-Noise Ratio (SNR): This is the electrical power ratio between the meaningful information (the signal) and the unwanted background noise. A higher ratio indicates less corruption by noise.
- Threshold: This is the minimum value of the input signal required to elicit any change in output or to start from zero. Accuracy and Precision
- Accuracy: This refers to the degree of closeness of the measurements to the actual or "true" value of the quantity being measured.
- Precision (Repeatability/Reproducibility): This is the degree to which repeated measurements under unchanged conditions show the same results. A sensor can be precise (repeatable) without being accurate (close to the true value). Behavioral and Dynamic Characteristics
- Linearity: This describes how well the sensor's output maintains a consistent ratio to the input across its entire range.
- Hysteresis: This is the phenomenon where a lag occurs between the application and removal of a stimulus, resulting in different outputs depending on whether the input is increasing or decreasing.
- Stability and Drift: Stability refers to the sensor's ability to maintain a repeatable output over time, while low drift indicates minimal unintended change in output when the input is constant.
- Response Time and Frequency Response: These quantify the sensor's dynamic response, specifically how quickly it reacts to changes (response time) and its effective operating range across different frequencies (bandwidth). Characteristics of an "Ideal" Sensor According to the sources, an ideal sensor should possess the following quantitative and qualitative traits:
- Large responsivity (providing a large output for a small input).
- Linearity and low hysteresis.
- Fast frequency response and wide bandwidth.
- Low power consumption, small volume, and low cost
How to estimate “Responsivity” for piezoresistive, capacitive, and piezoelectric MEMS sensors, i.e., what is the electrical output versus mechanical input relationship?
Responsivity is defined as the measure of the input-output relationship (gain or ratio) of a detector system. In the context of MEMS mechanical sensors, it is calculated as the Change in Output divided by the Change in Input.
The following sections detail how to estimate this relationship for different transduction principles based on the sources.
1. Piezoresistive MEMS Sensors
For a piezoresistive sensor, the mechanical input is typically force (
- Transduction Relationship: The change in resistivity is defined by the gauge factor (
) and strain ( ): . - Estimation Formula: By combining the relationship for strain on a cantilever beam (
) and the spring constant ( ), the responsivity is derived as: (Where is the length, is thickness, is width, and is Young's modulus).
2. Capacitive MEMS Sensors
In capacitive sensors (such as a diaphragm or comb-drive), the input is force (
- Transduction Relationship: Capacitance is defined as
, where is the gap (or displacement ). A change in displacement results in . - Estimation Formula: Using the mechanical stiffness relationship where displacement change per unit force is
, and assuming a small displacement compared to the initial gap ( ), the responsivity is: - Comparison Note: In typical MEMS dimensions, capacitive sensors are significantly more sensitive (often by a factor of ~3000/
) than piezoresistive ones, though they are more susceptible to noise.
3. Piezoelectric MEMS Sensors
Piezoelectric sensors generate an electrical charge (
- Longitudinal Effect: The charge is produced in the same direction as the force.
(Where is the piezoelectric coefficient and is the number of stacked elements). - Transverse Effect: Force is applied along a neutral axis, and charge is generated perpendicularly. This allows for fine-tuning sensitivity by adjusting the element's dimensions (
and ): - Shear Effect: For
elements in series, the charge is . - Voltage Output: The generated voltage (
) is also proportional to force. For example, when force is applied in the direction of thickness ( ), the relationship is .
Summary of "Good" Sensor Quantitative Traits
When estimating these relationships, an ideal sensor is characterized by large responsivity (high output for small input), linearity, and low hysteresis (minimal lag between application and removal of force).
What is an “ideal sensor”?
An ideal sensor is a device optimized across technical, physical, and economic dimensions to provide the most effective measurement of a physical parameter. According to the sources, an ideal sensor possesses the following key characteristics:
- Large Responsivity: It should provide a large output signal (such as voltage) even when the input is a very small quantity. Responsivity represents the "gain" or unique input-output relationship of the system.
- Linearity: The sensor's response should be linear across its operating range. In a linear system, the responsivity remains constant rather than varying as a local slope or derivative.
- Stability and Repeatability: It must provide a stable output with low drift over time. Additionally, it should be highly precise (repeatable), meaning it shows the same results consistently when measurements are repeated under unchanged conditions.
- Low Hysteresis: There should be minimal lag between the application and removal of a stimulus. An ideal sensor does not show different responses based on whether the input is increasing or decreasing.
- Dynamic Performance: The sensor should feature a fast frequency response and a wide bandwidth, allowing it to react quickly to rapid environmental changes.
- Physical and Economic Efficiency: Beyond measurement accuracy, an ideal sensor is designed for practical implementation, featuring low power consumption, small volume and weight, and a low cost for manufacturing.
In contrast to these ideal traits, real-world sensors are often evaluated by their threshold—the minimum input signal required to start a change from zero—and their signal-to-noise ratio (SNR), which quantifies how much the meaningful signal has been corrupted by background noise.